Overview
Summary
WOODS is a curated collection of benchmarks for the Out-of-Distribution (OoD) generalization field. It is specifically aimed at sequential prediction tasks, i.e. tasks where the data takes sequential or temporal form. Tasks fall under 2 categories: classification and regression. All datasets consist of multiple domains, each of which follows different data distributions, but all domains have the same target/task that we are trying to predict., e.g. EEG data of patients taken with different machines or trying to predict signed words from videos of different signers.
The methodology to measure domain generalization with our benchmarks is to create disjoint sets of training and testing domains. The training domain is used to train a model, and the testing domain is used to evaluate the model on OoD domains. Similar to cross-validation, we can evaluate over all domains (with one domain held-out) to have a complete evaluation of a method on a benchmark.
List
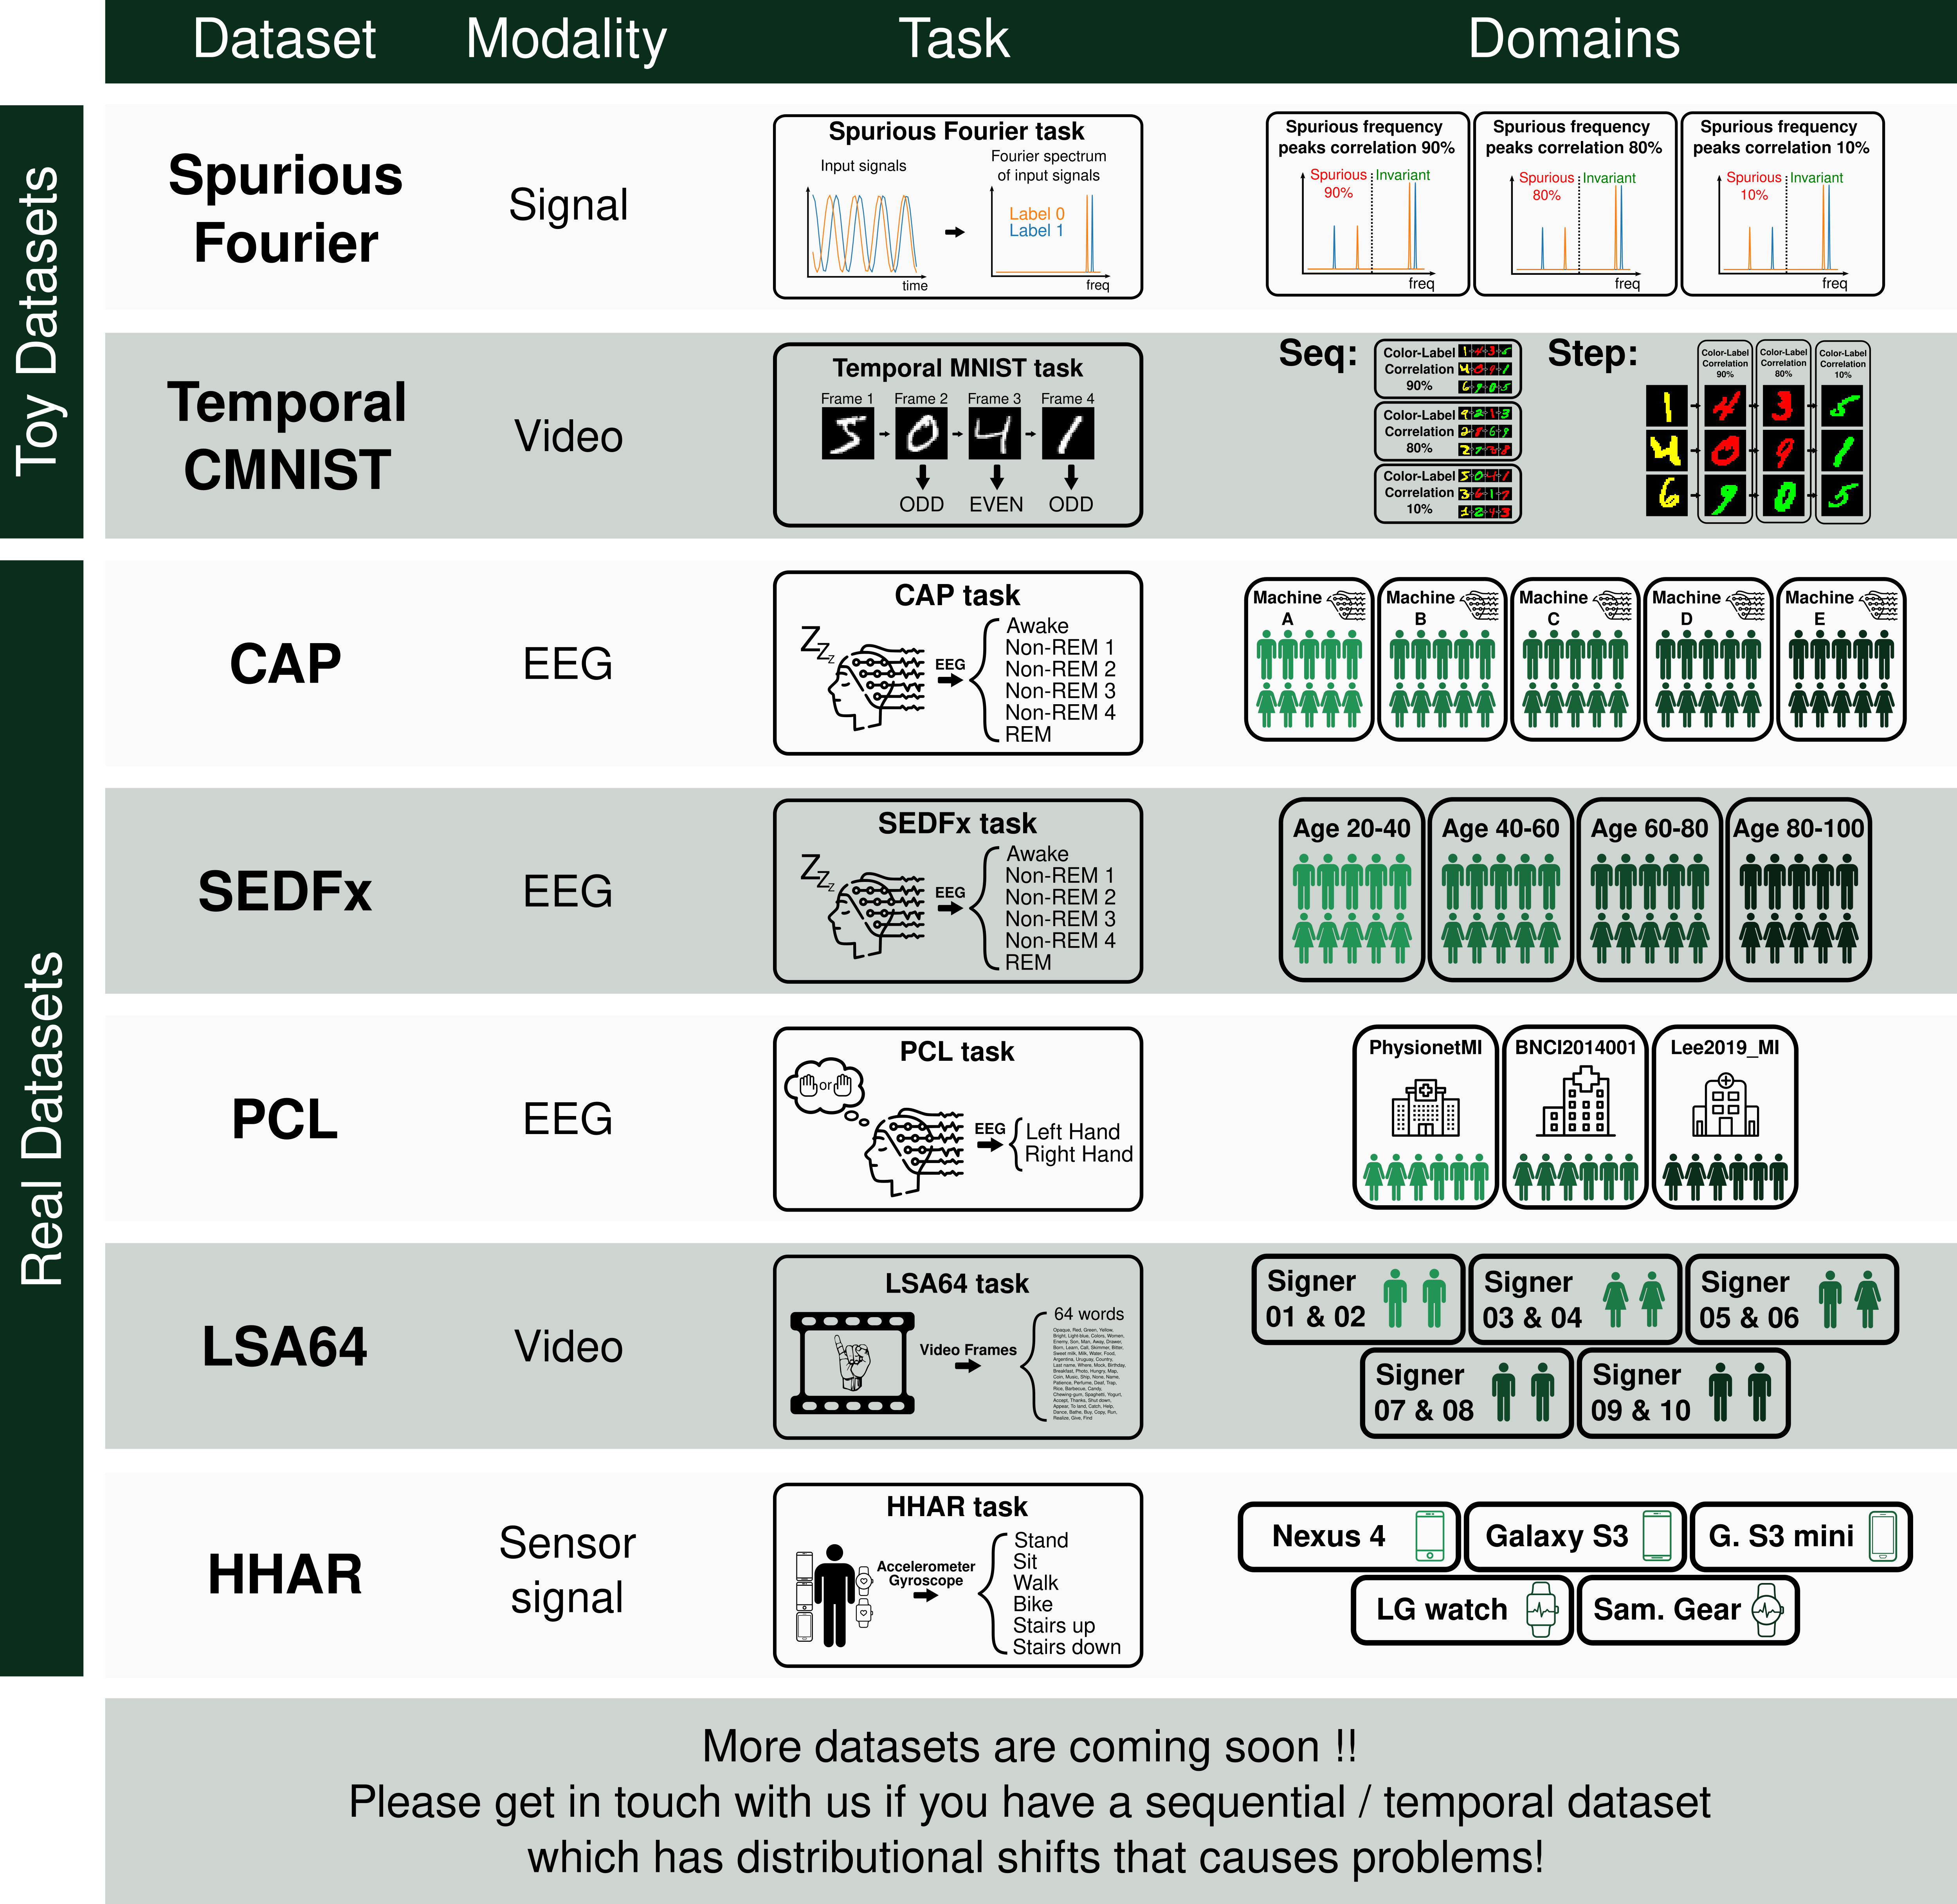
Figure 1: List of all available datasets in WOODS
Spurious Fourier
Motivation
At the time of WOODS creation, the OoD generalization field has little work addressing the possible distributional shifts that could appear in sequential/temporal data. Common toy/synthetic datasets that lead to better interpretation of the problem are all image based, e.g. Colored MNIST, Rotated MNIST. In this dataset we aim to show in a simple formulation that temporal data have their own problems which aren’t present in the image modality.
Problem
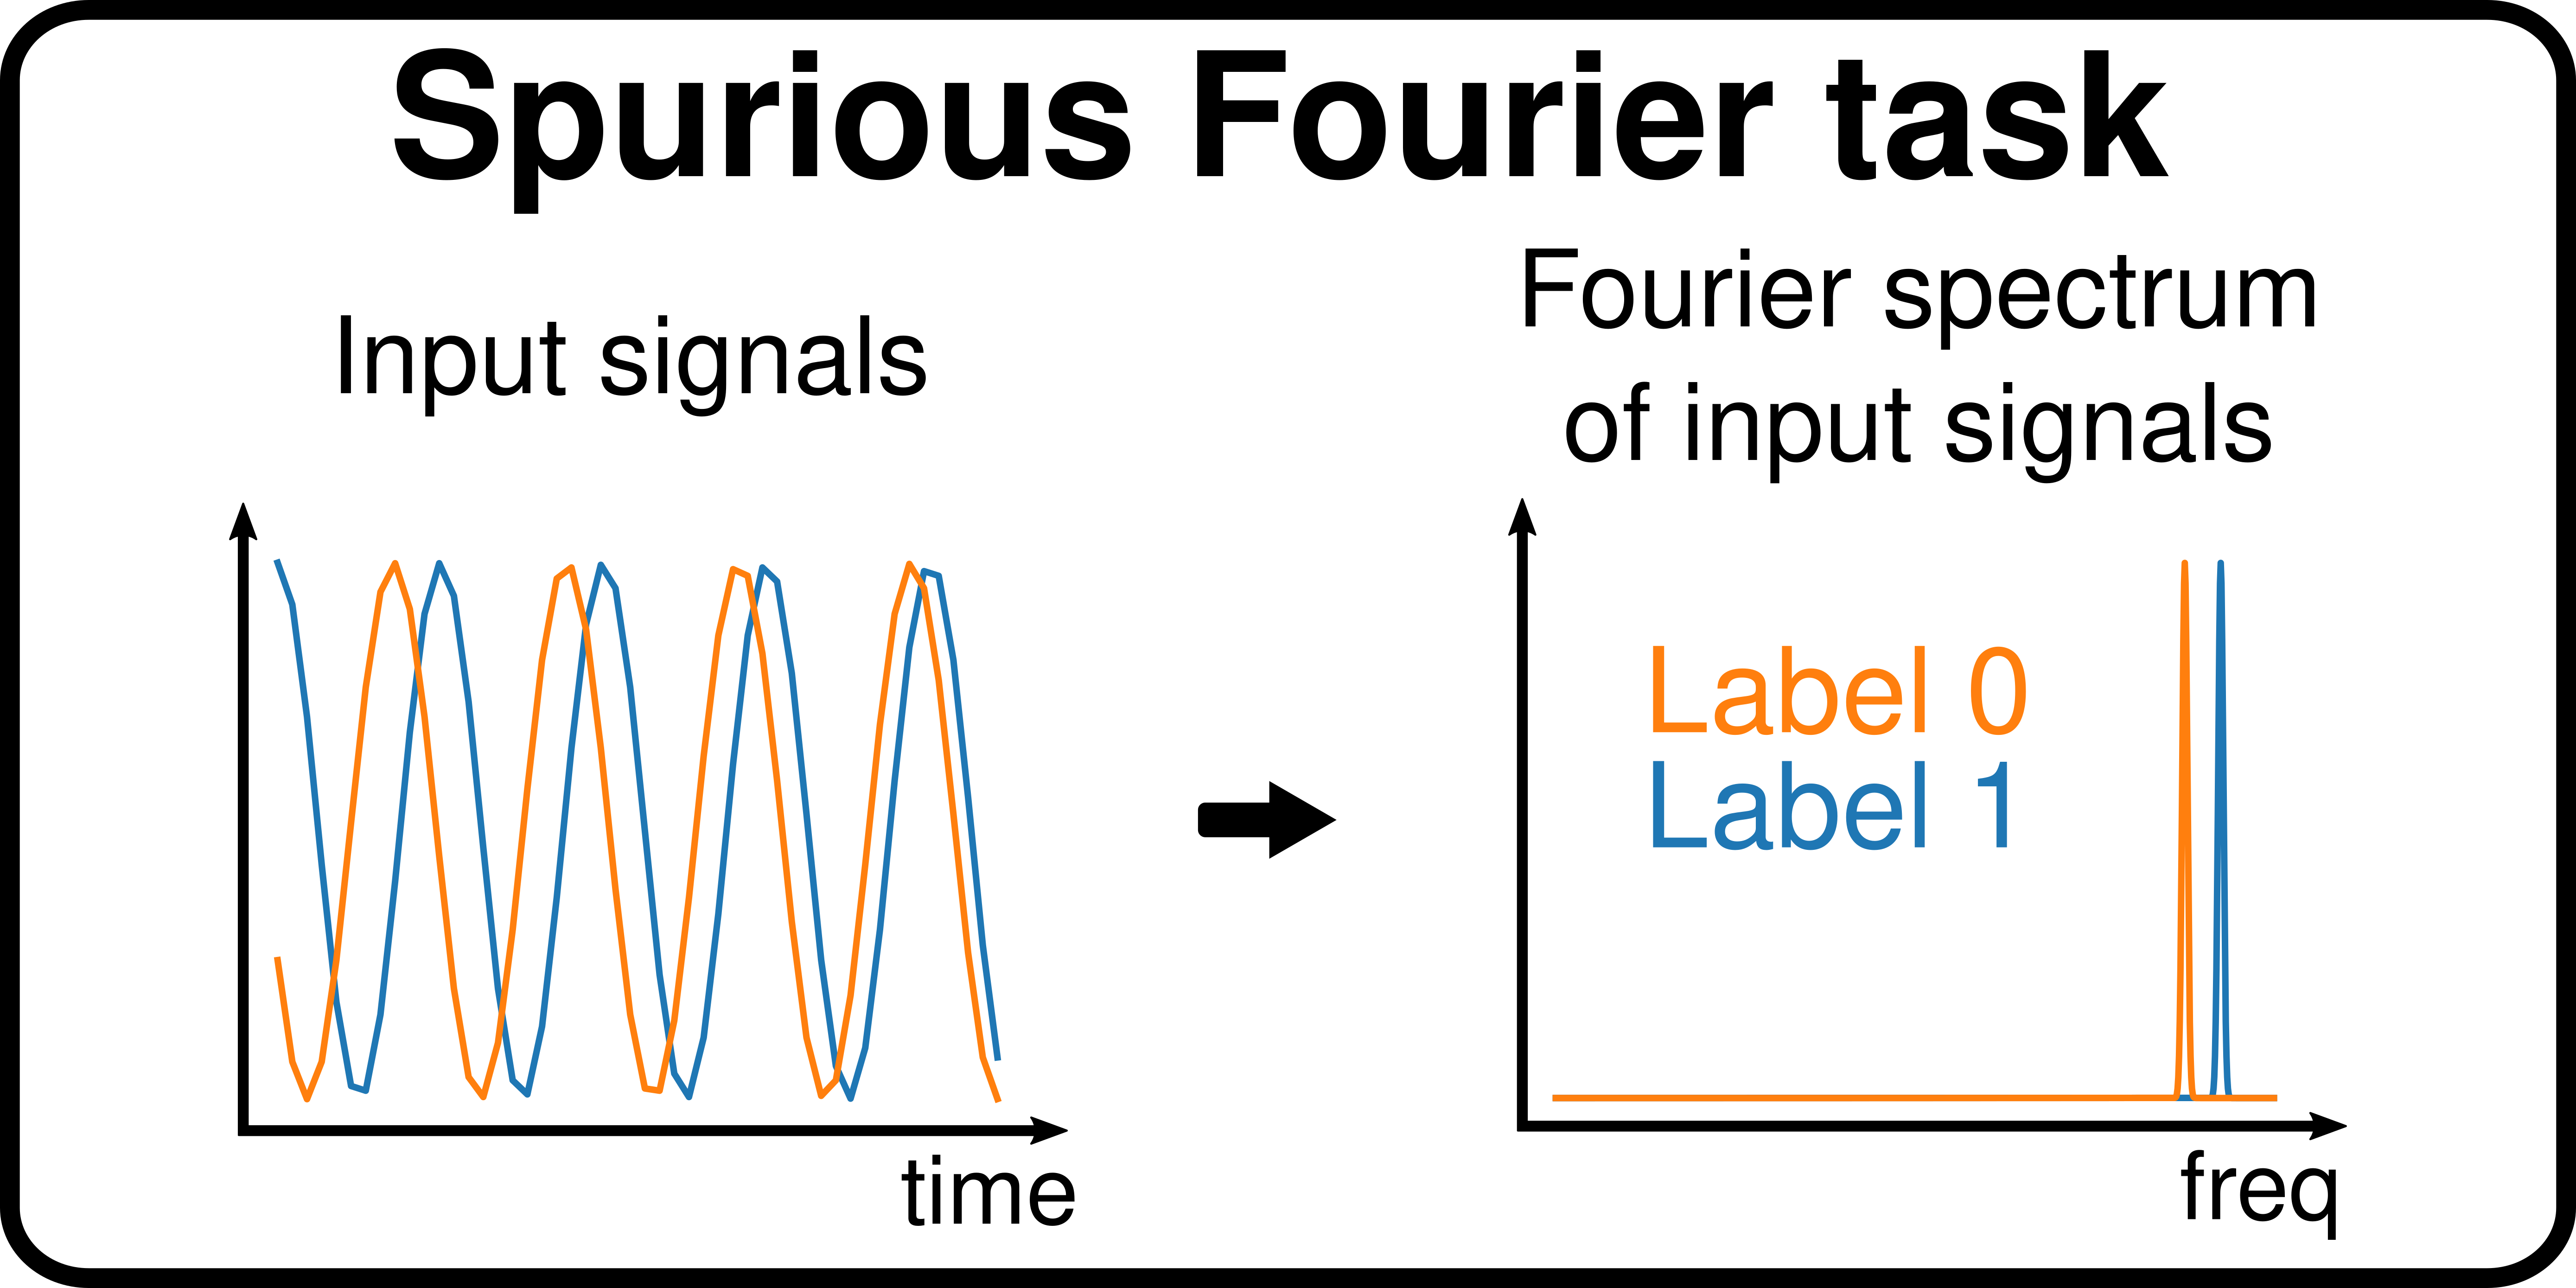
Figure 2: Spurious Fourier dataset task
The task here is to perform binary classification of 1 dimensional sinusoidal signals based on their frequency characteristics, i.e. their fourier spectrum. More specifically, the model has to predict if the signal belongs to the 50Hz or 60Hz peak (see Figure 2). This simple task is also in WOODS under the name of Basic_Fourier as a proof of concept that this task is feasible, but isn’t an OoD benchmark. However, we reproduce the distributional shift property of the Colored MNIST dataset. We first add 25% label noise to the whole dataset, so the maximum accuracy that can be achieved with the 50/60Hz peaks information is 75%. Then we add low frequency peaks to the fourier spectrum which are strongly correlated with the label. This level of correlation is a function of the data the domain is sampled from : [10,80%,90%] (See Figure 3).

Figure 3: Spurious Fourier domains
Temporal Colored MNIST
Motivation
In this effort to bring to light the new challenges in sequential/temporal data, we create this toy dataset in order to address the notion of domain definitions in sequential/temporal data. With this one dataset we investigate 2 domain definition paradigms.
The first paradigm is the same used in the image modality, where whole samples (or sequences) are sampled from a given domain. An example of this would be EEG data from patients taken from different machines, where whole recordings belong to a given machine and therefore it is most practical to define the domains as such.
The second paradigm, that is unique to sequential data, is that the domain definitions are a function of time. In other words, steps or groups of steps in sequences are sampled from different domains. An example of this would be stock market data from the past years where all indexes from the market are impacted in the same way in a given year, but that is changing year by year from societal events. With this logic one could assume that the stock market behavior of the year 2020 is OoD from the stock prices of all of the years before. The important point here is that the time domain affects all time series in the same way at a given time.
Problem
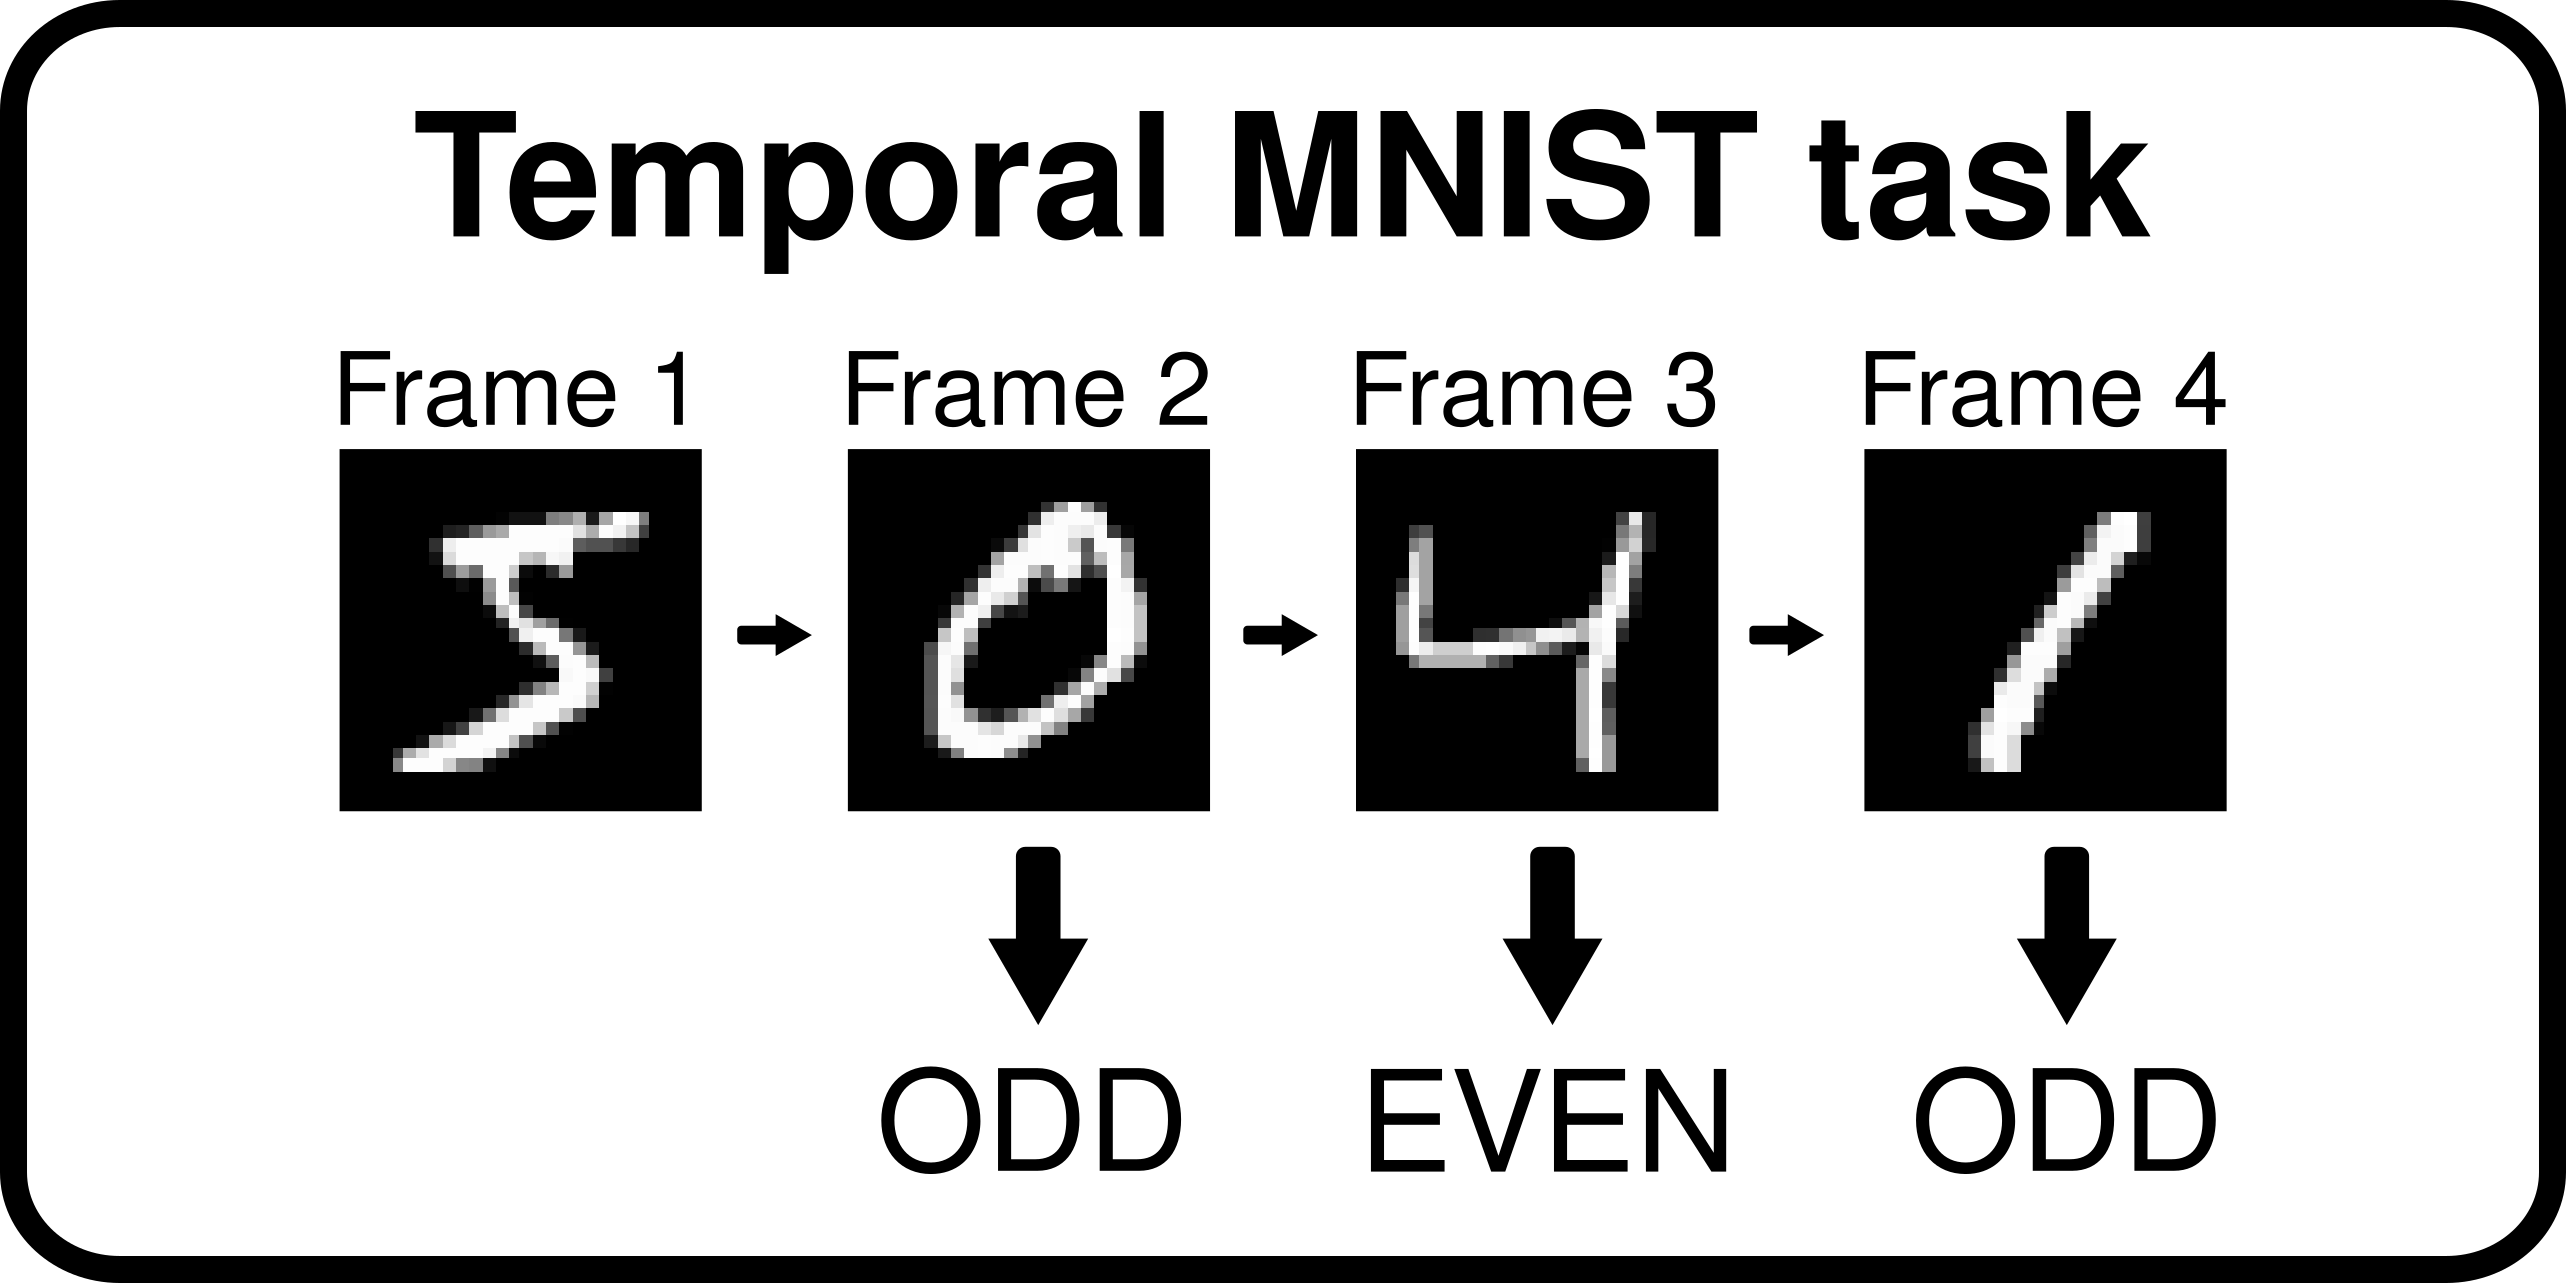
Figure 4: Temporal Colored MNIST task
In order to investigate this new unique setup, we create a semi-synthetic dataset using the MNIST dataset. We arranged all digits from MNIST into sequences of digits. Then the task is a binary classification task where the goal is to predict whether the sum of the current and previous digit in the sequence is odd or even. The sequences are 4 digits long and 3 predictions are made. This simple task is also in WOODS under the name of TMNIST (Temporal MNIST) as a proof of concept that this task is feasible, but isn’t an OoD benchmark.
From this formulation, we add spuriousness to the dataset in a similar way to Colored MNIST by first adding 25% label noise to the whole dataset. Then we add colors to the digits according to 2 different domain definition paradigms that take form in 2 different datasets: Temporal Colored MNIST Sequences and Temporal Colored MNIST Steps.
Temporal Colored MNIST Sequences
In this dataset we define the domains to the original way of doing domains, where whole sequences are sampled from a domain. This means that we color the whole sequences according to a constant correlation value that is defined by the domain: [10%, 80%, 90%].

Figure 5: Temporal Colored MNIST Sequences domains
Temporal Colored MNIST Steps
In this dataset we define the domains the novel way, where steps in the sequence are sampled from a domain. So a single frame in the sequence of digits is gonna have constant correlation value across all samples that is defined by the domain: [10%,80%,90%]
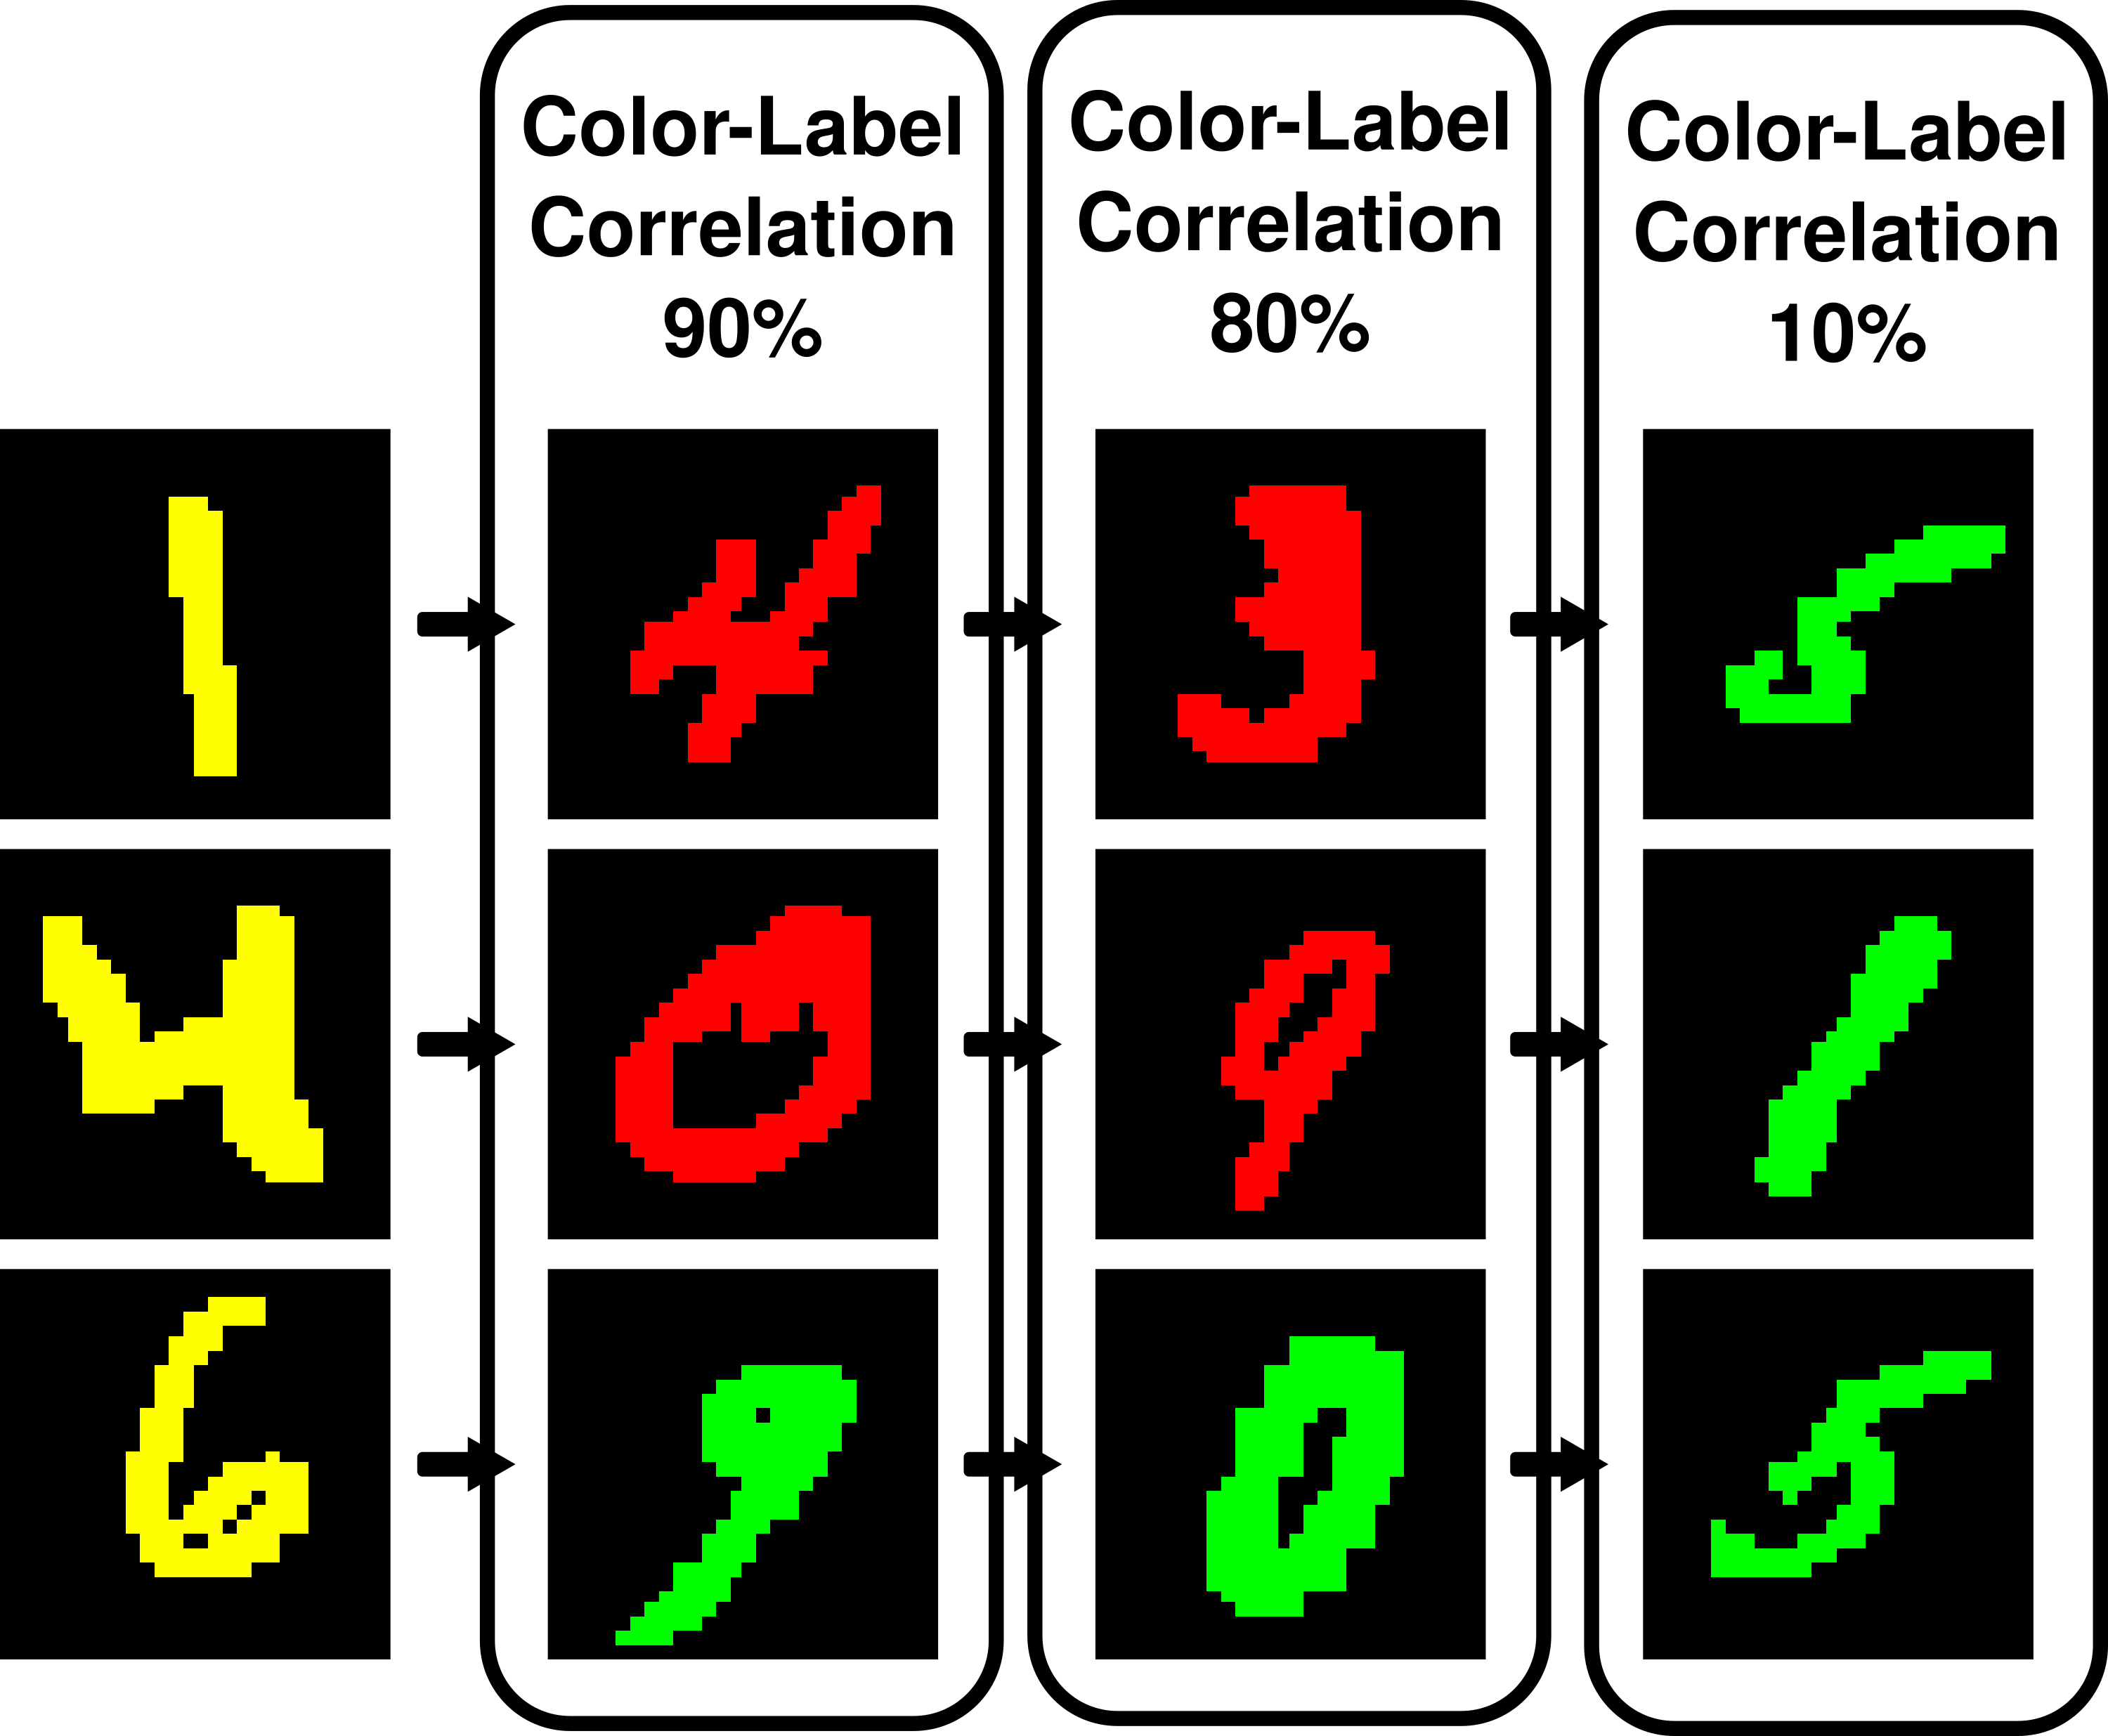
Figure 6: Temporal Colored MNIST Steps domains
CAP
Motivation
A recurrent problem in many modalities of the computational medicine field is that models trained on data coming from a given recording machine will not generalize to data coming from unseen machines. This is a problem as it can cause problems within the same institution as a false sense of confidence could be attributed to a model that, even though it was trained on data gathered from the same procedure, the simple fact of using a new machine used to gather data brings with it a distributional shift that causes the model to not perform as well as it did during training. This dataset is specifically designed to investigate the generalization of models to unseen machines with data acquisition following similar procedures, as all data was gathered in the same medical center.
Problem

Figure 7: CAP task
We consider the sleep classification task which consists of the 6 stages of sleep classification task from EEG measurements. The data comes from 5 different machines which act as 5 different domains. Patients are also different between domains.

Figure 8: CAP domains
Source & Citation
[1] Terzano MG, Parrino L, Sherieri A, Chervin R, Chokroverty S, Guilleminault C, Hirshkowitz M, Mahowald M, Moldofsky H, Rosa A, Thomas R, Walters A. Atlas, rules, and recording techniques for the scoring of cyclic alternating pattern (CAP) in human sleep. Sleep Med. 2001 Nov;2(6):537-53. doi: 10.1016/s1389-9457(01)00149-6. Erratum in: Sleep Med. 2002 Mar;3(2):185. PMID: 14592270.
[2] Goldberger, A., Amaral, L., Glass, L., Hausdorff, J., Ivanov, P. C., Mark, R., ... & Stanley, H. E. (2000). PhysioBank, PhysioToolkit, and PhysioNet: Components of a new research resource for complex physiologic signals. Circulation [Online]. 101 (23), pp. e215–e220.
License
This project is licensed under the Open Data Commons Attribution license v1.0.
SEDFx
Motivation
In computational medicine, the ultimate goal is to train a model on a set of data gathered from a small number of patients and then to apply this model on data coming from new patients in order to assist on the diagnosis of the patient. This generalization between observed patients in the training set of data and new patients at inference however isn’t something that is guaranteed. There may be distributional shifts in the demographics of the data used for training and data on which we use the model. These demographics shifts include age, gender, ethnicity and more. We study this problem of patient demographic shifts in the SEDFx dataset.
Problem

Figure 9: SEDFx task
We consider the sleep classification task which consists of the 6 stages of sleep classification task from EEG measurements. The data is split into 5 age-groups.

Figure 10: SEDFx domains
Source & Citation
[1] B. Kemp, A. H. Zwinderman, B. Tuk, H. A. C. Kamphuisen and J. J. L. Oberye, "Analysis of a sleep-dependent neuronal feedback loop: the slow-wave microcontinuity of the EEG," in IEEE Transactions on Biomedical Engineering, vol. 47, no. 9, pp. 1185-1194, Sept. 2000, doi: 10.1109/10.867928.
[2] Goldberger, A., Amaral, L., Glass, L., Hausdorff, J., Ivanov, P. C., Mark, R., ... & Stanley, H. E. (2000). PhysioBank, PhysioToolkit, and PhysioNet: Components of a new research resource for complex physiologic signals. Circulation [Online]. 101 (23), pp. e215–e220.
License
This project is licensed under the Open Data Commons Attribution license v1.0.
PCL
Motivation
In computational medicine, the ultimate goal is to train a model on a set of data gathered from a small number of patients and then to apply this model on data coming from new patients in order to assist on the diagnosis of the patient. Aside from previously mentioned distributional shifts caused by shifts in patient demographic and changes in machinery used for measurements, another contributing factor to distributional shift is the human factor impacting the procedures surrounding the data recording. Small changes in data gathering procedures can lead to failure of generalization between medical groups and hospitals, one known instance of this failure mode is the Camelyon17 dataset from WILDS. This challenge is especially prevalent in temporal medical data as machinery - like EEG, MEG and others - are very complex tools which are greatly affected by non-linear effects and modulations caused by context and preparations made before the recording. We investigate this procedural shift in data in the PCL dataset.
Problem

Figure 11: PCL task
There are 3 datasets [PhysionetMI, BNCI2014001, Lee2019_MI], which feature EEG recording from multiple research groups that share a common task. This task is binary classification of imagined hand movements (left or right) from EEG data. Two of those datasets are subsets of the original data as we took the intersection of the common labels across all 3 datasets (BNCI2014001 and Lee2019_MI have 2 more classes that are excluded in the frame of this benchmark).
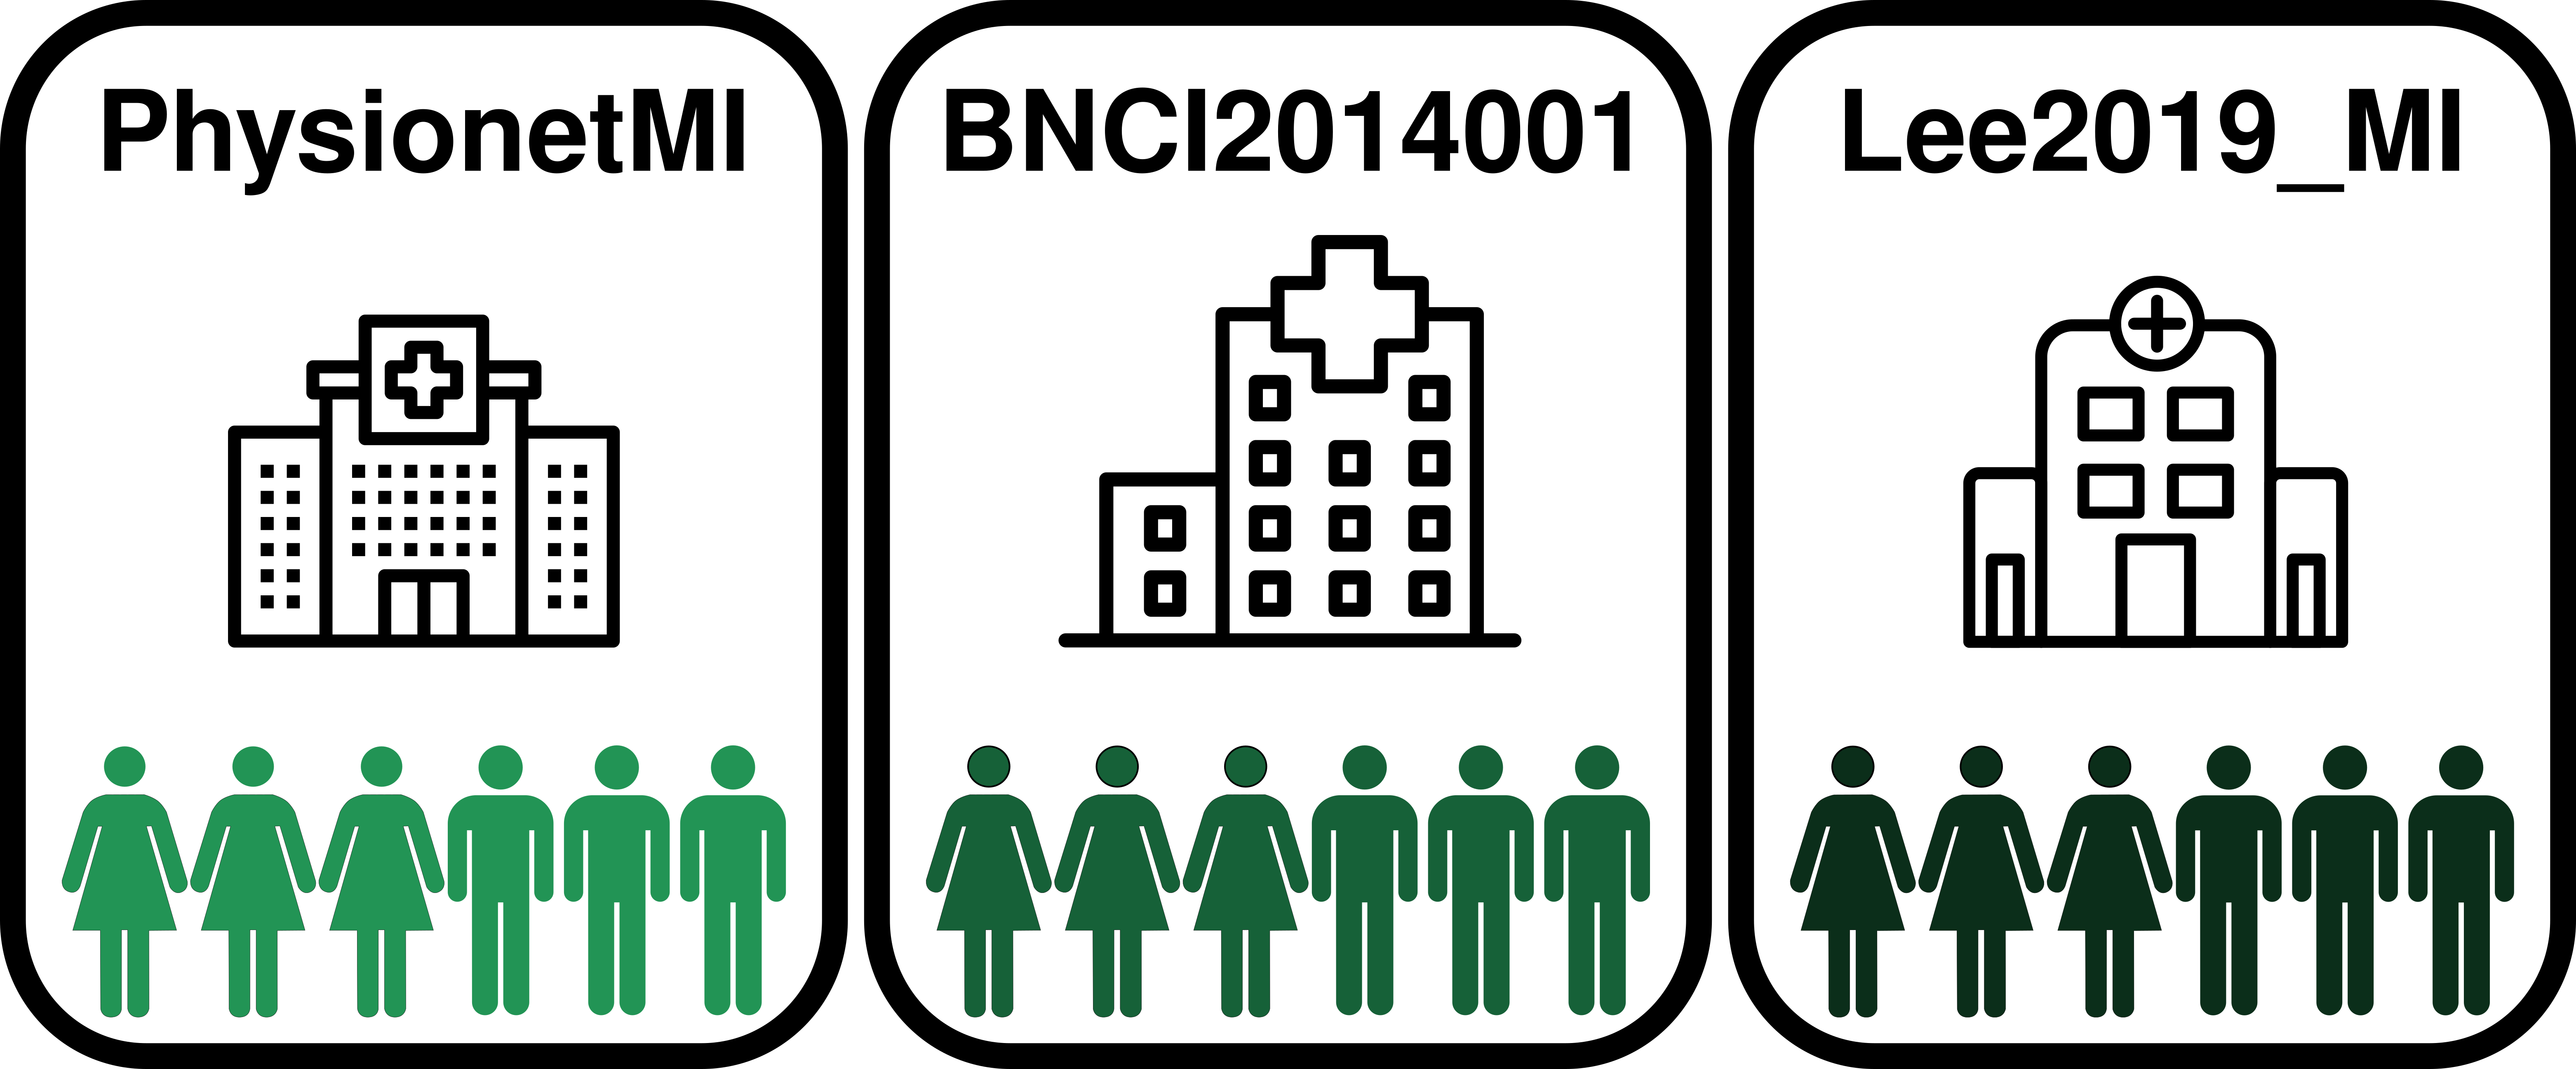
Figure 12: PCL domains
Source & Citation
[1] Tangermann, M., Müller, K.R., Aertsen, A., Birbaumer, N., Braun, C., Brunner, C., Leeb, R., Mehring, C., Miller, K.J., Mueller-Putz, G. and Nolte, G., 2012. Review of the BCI competition IV. Frontiers in neuroscience, 6, p.55.
[2] Schalk, G., McFarland, D.J., Hinterberger, T., Birbaumer, N. and Wolpaw, J.R., 2004. BCI2000: a general-purpose brain-computer interface (BCI) system. IEEE Transactions on biomedical engineering, 51(6), pp.1034-1043.
[3] Goldberger, A.L., Amaral, L.A., Glass, L., Hausdorff, J.M., Ivanov, P.C., Mark, R.G., Mietus, J.E., Moody, G.B., Peng, C.K., Stanley, H.E. and PhysioBank, P., PhysioNet: components of a new research resource for complex physiologic signals Circulation 2000 Volume 101 Issue 23 pp. E215–E220.
[4] Lee MH, Kwon OY, Kim YJ, Kim HK, Lee YE, Williamson J, Fazli S, Lee SW. EEG dataset and OpenBMI toolbox for three BCI paradigms: an investigation into BCI illiteracy. Gigascience. 2019 May 1;8(5):giz002. doi: 10.1093/gigascience/giz002. PMID: 30698704; PMCID: PMC6501944.
License
This dataset gathers data from multiple sources, therefore has multiple licenses attached to the dataset. The physionetMI dataset is licensed under the Open Data Commons Attribution license v1.0. The Lee2019_MI dataset is licensed under No Rights Reserved License. The BNCI2014001 dataset is freely available on the BCI Competition IV website with the only restriction that [1] is referenced upon publication of results.
HHAR
Motivation
In temporal data, the invariant features needed to make predictions might be highly convolved in time with other uninformative features. The ability to extract causal temporal features from data is a very hard task that is needed in order to find a representation of the data that is invariant and interpretable. This dataset serves the purpose of investigating the ability of models to ignore uninformative information from complex signals.
Problem

Figure 13: HHAR task
The task is a 6-class activity classification task from sensor data gathered from portable devices (phones and smart watches). Sensor data consists of 3-axis accelerometer measurements and 3-axis gyroscope measurements. There are 5 domains stemming from 5 different devices: [Nexus4, S3, S3Mini, LGWatch, Gear watch]. The challenge is to find the invariant sensory features across phones and watches, which aren’t located on the same body parts. Here watches might have extra oscillations on certain axes compared to phones while walking for example since they are worn on the wrists.

Figure 14: HHAR domains
Source & Citation
[1] Allan Stisen, Henrik Blunck, Sourav Bhattacharya, Thor Siiger Prentow, Mikkel Baun Kjærgaard, Anind Dey, Tobias Sonne, and Mads Møller Jensen "Smart Devices are Different: Assessing and Mitigating Mobile Sensing Heterogeneities for Activity Recognition" In Proc. 13th ACM Conference on Embedded Networked Sensor Systems (SenSys 2015), Seoul, Korea, 2015.
[2] Dua, D. and Graff, C. (2019). UCI Machine Learning Repository [http://archive.ics.uci.edu/ml]. Irvine, CA: University of California, School of Information and Computer Science.
License
This project is licensed under the Open Data Commons Attribution license v1.0.
LSA64
Motivation

Figure 15: LSA64 task
Communication is an idiosyncratic way to convey information through different mediums: text, speech, body language, etc. Some mediums, though, are more idiosyncratic than others. For example, text has less individuality than body language or speech. If AI systems hope one day to interact with humans effectively, models need to be able to generalize their learnings to previously unseen mannerism, accents, intonations and other variations in communication that are subtle but have great impact on the information conveyed. This dataset aims to benchmark this ability of models to understand information coming from unseen individuals.
Problem

Figure 16: LSA64 domains
The task of this dataset is to perform 64 class classification on videos of signed words in Argentinian Sign Language. Videos are of 10 different signers, we create 5 domains consisting of 2 speakers each.
Source & Citation
[1] Ronchetti, F., Quiroga, F., Estrebou, C., Lanzarini, L., & Rosete, A. (2016). LSA64: A Dataset of Argentinian Sign Language. XX II Congreso Argentino de Ciencias de la Computación (CACIC).
License
This project is licensed under the Creative Commons Attribution-NonCommercial-ShareAlike 4.0 International License
